
-
Experts in Data Visualization
Energy / Cities / Environment

-
Energy
-
Cities
-
Environment


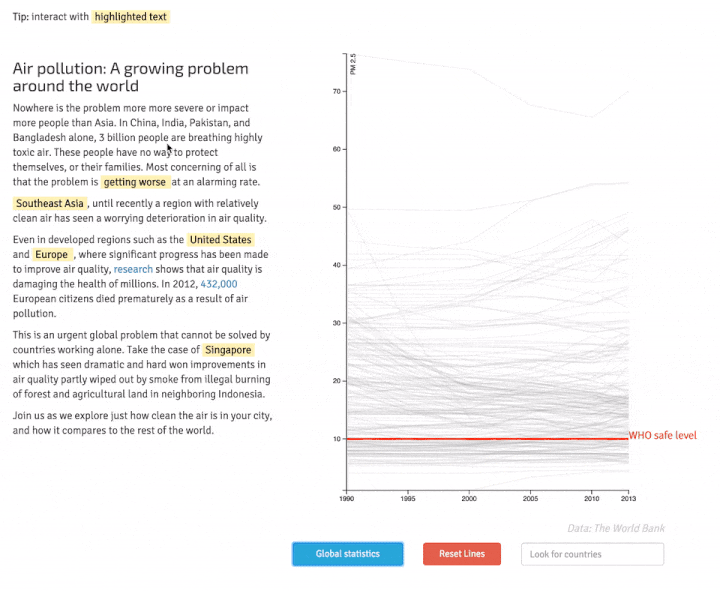
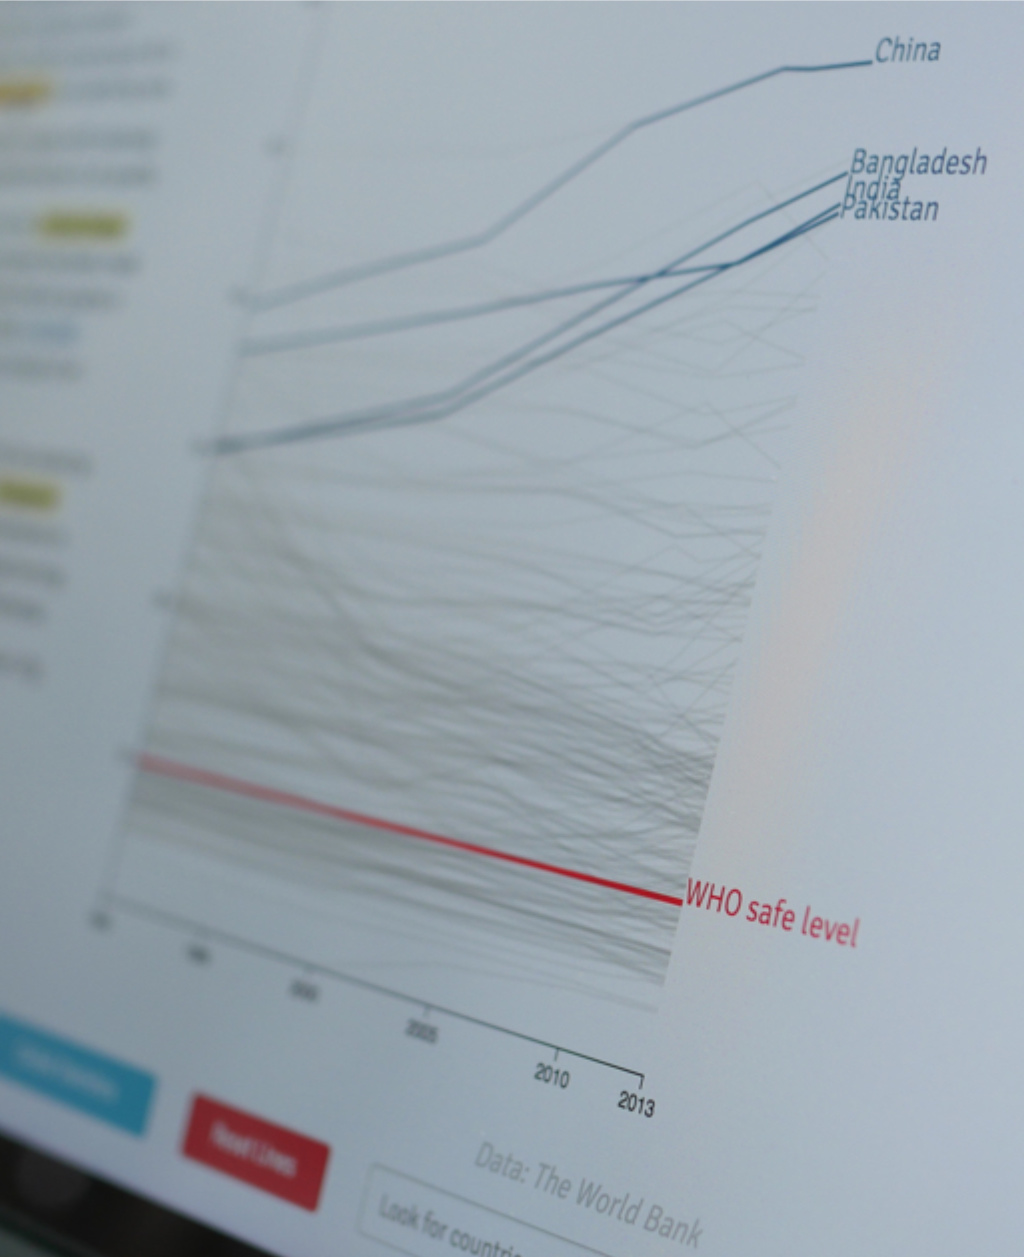
Discover how visualizations designed using cognitive science and the latest web technologies will let you do amazing things with your data.
Get your data noticed
Our brains are wired to filter out background "noise" and focus on what's important. Your data needs to engage readers quickly and deliver memorable insights, or it simply gets lost in the crowd.
Our visualizations employ techniques such as visual pop-out, interactivity, and live text elements that link the story to the data in a way that grabs readers attention and helps deliver your message.
Cookie cutter doesn't cut it
Like us, you've probably had to sit through more than your fair share of bland presentations with generic, off the shelf data plots. We promise never to inflict that kind of pain on you.
We design and build custom interactive visualizations that people actually enjoy using, and happy users make for memorable data.
Immersive data experiences
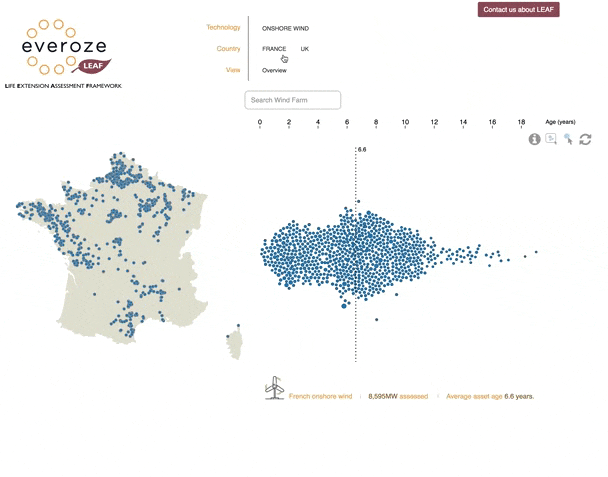
We employ the latest web technologies so you can navigate complex, multi-dimensional data sets on a single screen.
Intelligent search, tool-tip functionality, and smart filtering between views helps extract all the value from rich data and make it accessable to your audience.
Beyond data points
Sometimes the most powerful visualizations don't come from numbers and data points.
We constantly challenge ourselves to find unique and more effective ways to represent visual information.